Inventory
Weekly Market Report
 For Week Ending July 3, 2021
Mortgage applications decreased 1.8% last week, falling to the lowest level since January 2020, according to the Mortgage Bankers Association’s seasonally adjusted index, with declines noted in both refinance and purchase applications. Rising home prices and low inventory are responsible for the decline, even as mortgage rates remain low, causing experts to speculate whether the roaring housing market is finally cooling down.
In the Twin Cities region, for the week ending July 3:
- New Listings decreased 1.9% to 1,343
- Pending Sales increased 4.3% to 1,610
- Inventory decreased 33.5% to 6,906
For the month of April:
- Median Sales Price increased 16.6% to $344,000
- Days on Market decreased 41.5% to 24
- Percent of Original List Price Received increased 4.4% to 104.0%
- Months Supply of Homes For Sale decreased 50.0% to 1.1
All comparisons are to 2020
Click here for the full Weekly Market Activity Report. From MAAR Market Data News.
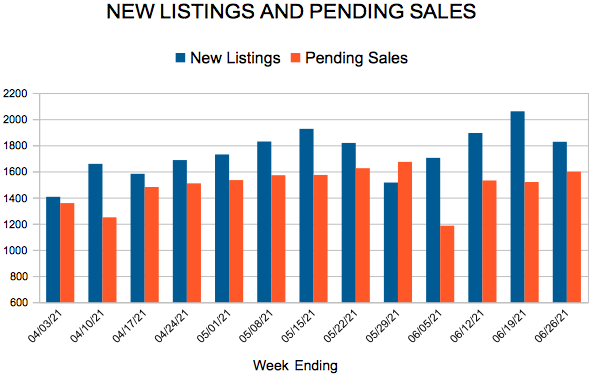
New Listings and Pending Sales
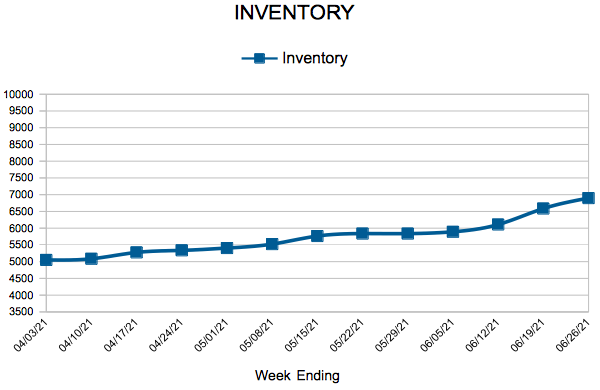
Inventory
Weekly Market Report
 For Week Ending June 26, 2021
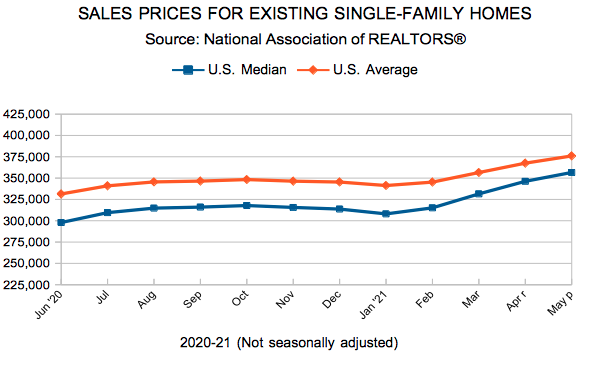
The U.S. Department of Labor reported unemployment claims fell to 364,000 for the week ending June 26, down 51,000 from the previous week’s revised total and the lowest level for initial jobless claims since the pandemic began. Nationwide, the existing-home median sales price set a new record high of $350,300, a 23.6% year-over-year increase, according to the National Association of REALTORS®. Some economists are predicting an increased supply of homes for sale in coming months, which may help to moderate home price increases later in the year.
In the Twin Cities region, for the week ending June 26:
- New Listings increased 5.4% to 1,827
- Pending Sales decreased 3.9% to 1,598
- Inventory decreased 34.2% to 6,898
For the month of April:
- Median Sales Price increased 16.6% to $344,000
- Days on Market decreased 41.5% to 24
- Percent of Original List Price Received increased 4.4% to 104.0%
- Months Supply of Homes For Sale decreased 50.0% to 1.1
All comparisons are to 2020
Click here for the full Weekly Market Activity Report. From MAAR Market Data News.
Existing Home Sales
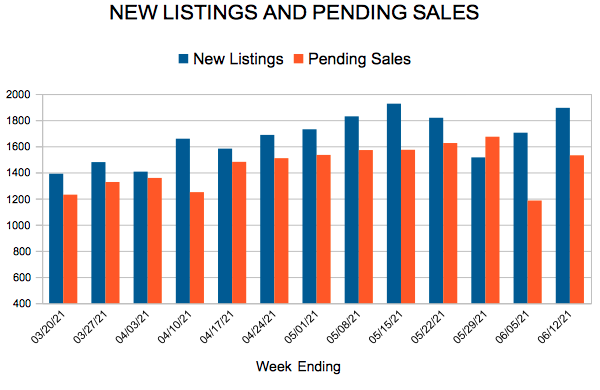
New Listings and Pending Sales
Inventory
Weekly Market Report
 For Week Ending June 12, 2021
U.S. median rental prices increased 5.5% year over year for an average of $1,527 in May, exceeding pre-pandemic figures and putting rents at their highest level in two years, according to realtor.com’s Monthly Rental Report. Meanwhile, after months of record highs, lumber prices have finally begun falling, with futures for July delivery down 41% since May’s record high, their biggest ever weekly loss, Bloomberg reports. Still, demand for housing remains strong as ever, with mortgage and refinance applications up from the previous week, according to the Mortgage Bankers Association.
In the Twin Cities region, for the week ending June 12:
- New Listings increased 9.5% to 1,894
- Pending Sales increased 4.6% to 1,531
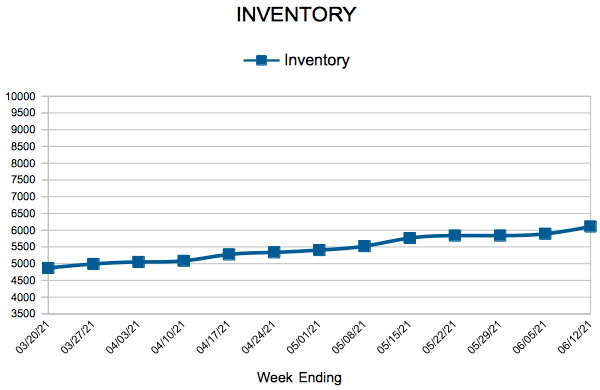
- Inventory decreased 42.4% to 6,109
For the month of April:
- Median Sales Price increased 16.6% to $343,750
- Days on Market decreased 41.5% to 24
- Percent of Original List Price Received increased 4.4% to 104.0%
- Months Supply of Homes For Sale decreased 54.5% to 1.0
All comparisons are to 2020
Click here for the full Weekly Market Activity Report. From MAAR Market Data News.
- « Previous Page
- 1
- …
- 86
- 87
- 88
- 89
- 90
- …
- 102
- Next Page »


