Weekly Market Report

For Week Ending February 5, 2022

Despite falling temperatures and a surge in COVID-19 cases across the country, the U.S. real estate market remains active, with homes selling in record time due to robust buyer demand and a shortage of housing options. With inventory down 28.4% compared to a year ago, the average home spent just 61 days on the market in January, a 14% drop from last year and the fastest pace of any January on record, according to Realtor.com’s monthly housing report.

IN THE TWIN CITIES REGION, FOR THE WEEK ENDING FEBRUARY 5:

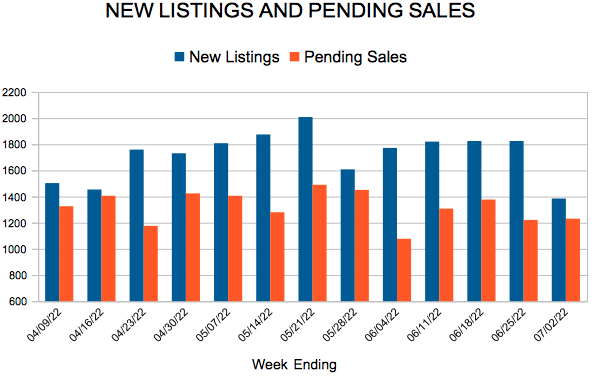
  • New Listings decreased 15.3% to 1,018
  • Pending Sales decreased 19.1% to 883
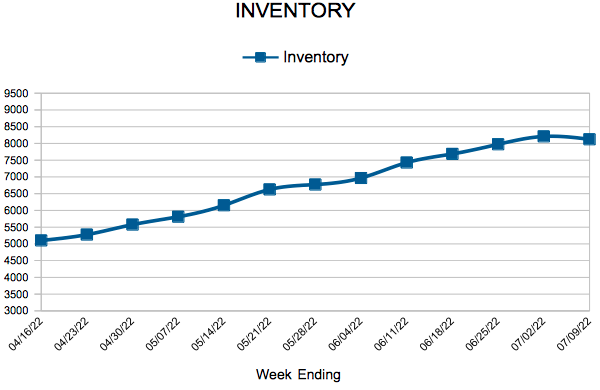
  • Inventory decreased 21.2% to 4,341

FOR THE MONTH OF DECEMBER:

  • Median Sales Price increased 8.0% to $331,420
  • Days on Market decreased 12.8% to 34
  • Percent of Original List Price Received decreased 0.2% to 99.5%
  • Months Supply of Homes For Sale decreased 18.2% to 0.9

All comparisons are to 2021

Click here for the full Weekly Market Activity Report. From MAAR Market Data News.

Mortgage Rates Jump

February 10, 2022
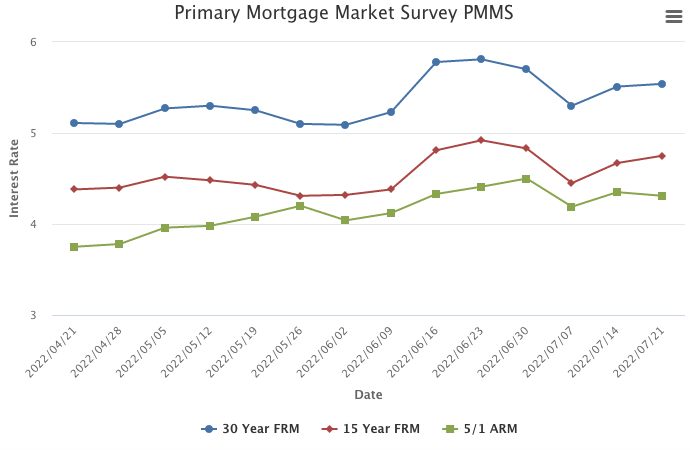
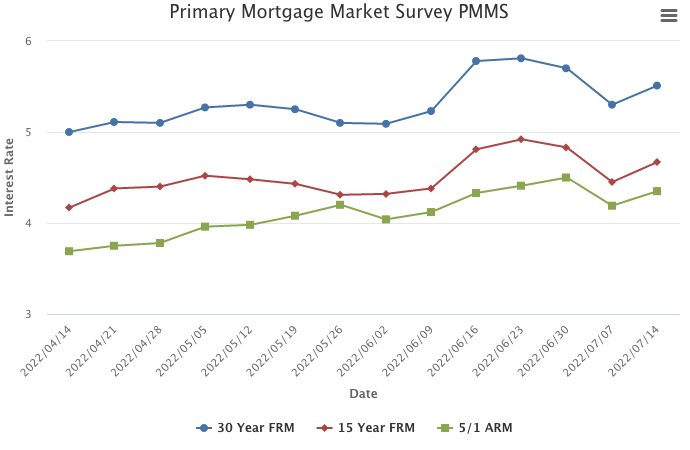
The normalization of the economy continues as mortgage rates jumped to the highest level since the emergence of the pandemic. Rate increases are expected to continue due to a strong labor market and high inflation, which likely will have an adverse impact on homebuyer demand.

Information provided by Freddie Mac.

Weekly Market Report

For Week Ending January 29, 2022

Home seller profits increased in more than 90% of housing markets last year, the highest level since 2008, according to ATTOM Data Solutions’ Year-End 2021 U.S. Home Sales Report. On average, sellers saw a profit of $94,092 on a typical median-priced home in 2021, an increase of 45% from 2020 and up 71% from 2019. Sellers saw a 45.3% return on investment compared to the original purchase price, with the highest profits found among sellers in western states.

IN THE TWIN CITIES REGION, FOR THE WEEK ENDING JANUARY 29:

  • New Listings decreased 17.8% to 850
  • Pending Sales decreased 12.8% to 826
  • Inventory decreased 21.2% to 4,432

FOR THE MONTH OF DECEMBER:

  • Median Sales Price increased 7.9% to $331,270
  • Days on Market decreased 12.8% to 34
  • Percent of Original List Price Received decreased 0.2% to 99.5%
  • Months Supply of Homes For Sale decreased 18.2% to 0.9

All comparisons are to 2021

Click here for the full Weekly Market Activity Report. From MAAR Market Data News.

Weeklly Market Report

For Week Ending January 22, 2022

With a shortage of options and bidding wars reaching an all-time high last year, an increasing number of buyers waived financing, appraisal, and inspection contingencies in hopes of making their offers more attractive to sellers. That number has been trending downward in recent months, according to the National Association of REALTORS® December 2021 REALTORS® Confidence Index Survey, which reports that while 79% of buyers waived a contract contingency in June 2021, only 60% of buyers did so in December.

IN THE TWIN CITIES REGION, FOR THE WEEK ENDING JANUARY 22:

  • New Listings decreased 10.9% to 845
  • Pending Sales decreased 15.6% to 767
  • Inventory decreased 21.5% to 4,491

FOR THE MONTH OF DECEMBER:

  • Median Sales Price increased 7.9% to $331,100
  • Days on Market decreased 12.8% to 34
  • Percent of Original List Price Received decreased 0.2% to 99.5%
  • Months Supply of Homes For Sale decreased 27.3% to 0.8

All comparisons are to 2021

Click here for the full Weekly Market Activity Report. From MAAR Market Data News.

In 2021 Twin Cities Housing Supply Fell Short Given Historic Demand

Tight supply and record demand pushed prices higher, market times lower and sapped inventory

Minneapolis–Saint Paul, Minnesota (January 24, 2022) – In 2021, housing demand reached a 20-year high while the number of homes for sale hit a 20-year low, according to an annual report issued by Minneapolis Area REALTORS® and the St. Paul Area Association of REALTORS®. That dynamic has been driving virtually every other housing indicator. For sellers, the year brought record prices, blazing fast market times, offers over asking price and a thin market where their homes stood out.“While the year was undeniably strong, we did see sales activity slow and price gains moderate in the second half of the year,” said Mark Mason, President of the Saint Paul Area Association of REALTORS®. “Ten percent price growth or higher simply isn’t sustainable long term. But we do expect the landscape to remain competitive in 2022 after not knowing what to expect the last couple years.”

For buyers, motivation from historically low mortgage rates, a desire for more space for remote work and learning, and an economy recovering from the pandemic crashed right into the supply shortage. These factors have caused some buyer fatigue and raised affordability concerns. The supply-demand imbalance has created a competitive environment where multiple offers are commonplace.

“Some aspiring buyers grew frustrated with a market favoring sellers. I worked with several buyers who wrote upwards of five offers but we kept losing out, particularly in the more affordable segments,” said Denise Mazone, President of the Minneapolis Area REALTORS®. “The [housing] shortage is so persistent. We need about five to six times our current inventory levels just to reach a balanced market. That said, these low mortgage rates have partly offset the effect of rising prices on monthly payments.”

While single family homes make up most of our market, sales of townhomes and condos rose ten times as fast. Labor constraints and supply chain disruptions meant builders listed fewer—and buyers closed on fewer—newly built homes than in 2020. Despite some concerns around forbearances, lender-mediated activity (foreclosures and short sales) declined significantly from already low levels to about half a percent of all sales. 30-year fixed rates started the year at 2.65 percent and ended at 3.1 percent, though they’ve already touched 3.45 percent in 2022 given rising inflation. That could dampen demand in 2022 and restrain price growth which, if combined with an increase in listings, may start to impact market balance. We’ve been in a seller’s market for 10 straight years; perhaps a shift in the power balance is just what disheartened buyers need.

2021 by the Numbers Compared to 2020

  • Sellers listed 75,536 properties on the market, a 1.1 percent decrease from 2020
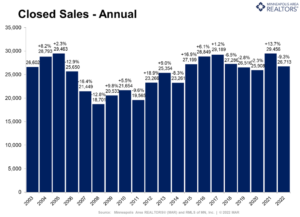
  • Buyers closed on 66,319 properties, up 2.7 percent (65,937 pending sales, up 0.2 percent)
  • The Median Sales Price rose 11.4 percent to $339,900
  • Inventory levels fell 26.4 percent to 6,742 units on average over the last 12 months
  • Months Supply of Inventory was down 33.3 percent to 1.2 months on average (5-6 months is balanced)
  • Days on Market decreased 34.9 percent to 28 days, on average (median of 11, down 38.9 percent)
  • Changes in Sales activity varied by market segment
    • Single family sales were up 0.8 percent; condo sales grew 25.1 percent; townhome sales increased 2.6 percent
    • Traditional sales rose 3.5 percent; foreclosure sales were down 53.1 percent; short sales fell 51.7 percent
    • Previously owned sales increased 3.7 percent; new construction sales fell 6.2 percent
    • $1M+ luxury sales surged 50.6 percent to a record high

Charting the Market
Seller activity (new listings) was down slightly from 2020 and reached its lowest level since 2014 despite record sales. Some drivers include hesitance around showings during a pandemic, having no place to go, refinancing to a lower rate, weak new construction activity and Baby Boomers aging in place instead of listing their homes. Disheartened buyers have been thirsty for more inventory for years.

Housing demand has rocketed higher over the last two years. Buyers were motivated by a desire for more space to work and learn from home, historically low interest rates, more options due to remote work and maybe even a fear of missing out. The condo and luxury $1M+ sub-markets outperformed other market segments. Sales would’ve undoubtedly been higher if we had sufficient supply.

With supply at a 20-year low and demand at a 20-year high, it’s no surprise the median sales price rose to set a new record. Home prices have risen 126.6% from their low point in 2011 and 47.8% from their prior 2006 peak. Rising prices boost equity and theoretically should motivate some reluctant sellers. But it also gives rise to affordability challenges.


Inventory levels declined almost every year since 2007, bringing housing supply levels down 84.4% from their peak. On average, buyers had 6,800 options during the year and nearly 9,000 in September. This supply-side constraint has led to bidding wars and rising prices. The shortage has frustrated some buyers—particularly at the entry-level price points. More supply is vital to market health and to increase housing opportunities.

Multiple offers—often above asking price—has allowed sellers to yield 101.9% of their asking price. That varied by area, property type and price point. Sellers find that listings stand out in an undersupplied market. Proper pricing was still important for motivated sellers. But a historic high for this ratio of sold to list price reflects highly motivated buyers as well as the imbalance between supply and demand.


Homes are selling at the fastest pace on record. Between May and July, half the homes sold in under a week, but more like 11 days for the year. That’s down 90.5% from 2008. Here again the inventory shortage and historic demand meant buyers pounce on attractive listings right away. Homes didn’t linger on the market for long. Even so, more homes selling in record time and at record prices couldn’t entice more sellers onto the dance floor.

From The Skinny Blog.