Inventory
Weekly Market Report
 For Week Ending April 2, 2022
The median national home price recently hit a new all-time high of $405,000 in March, a 13.5% increase annually, according to Realtor.com’s latest Monthly Housing Trends Report. As home prices continue to rise, the share of homes experiencing price reductions has also grown, with 25 of the 50 largest metro areas reporting an increase in price reductions last month, up from 18 in February, which may be an early sign the housing market is moderating somewhat.
IN THE TWIN CITIES REGION, FOR THE WEEK ENDING APRIL 2:
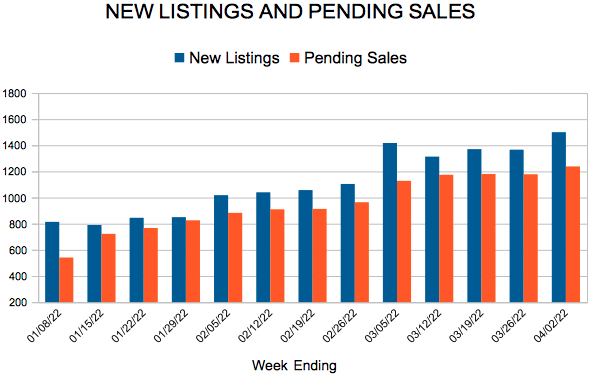
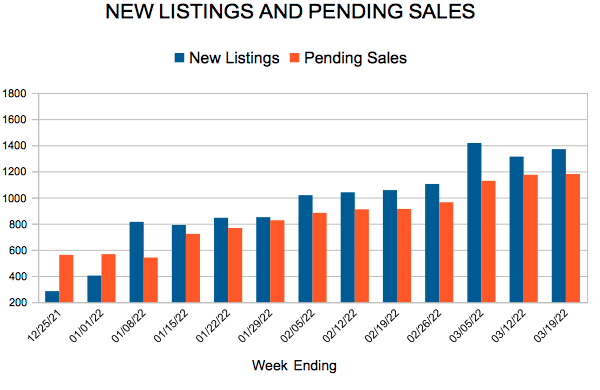
- New Listings increased 0.2% to 1,500
- Pending Sales decreased 11.4% to 1,238
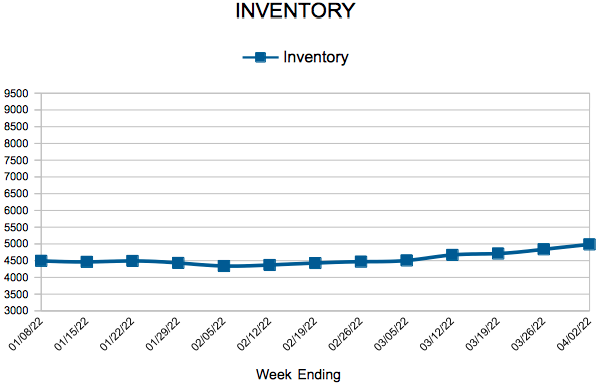
- Inventory decreased 11.8% to 4,986
FOR THE MONTH OF FEBRUARY:
- Median Sales Price increased 8.3% to $340,000
- Days on Market decreased 4.3% to 44
- Percent of Original List Price Received increased 0.7% to 100.8%
- Months Supply of Homes For Sale decreased 10.0% to 0.9
All comparisons are to 2021
Click here for the full Weekly Market Activity Report. From MAAR Market Data News.
Mortgage Rates Continue Climbing
April 7, 2022
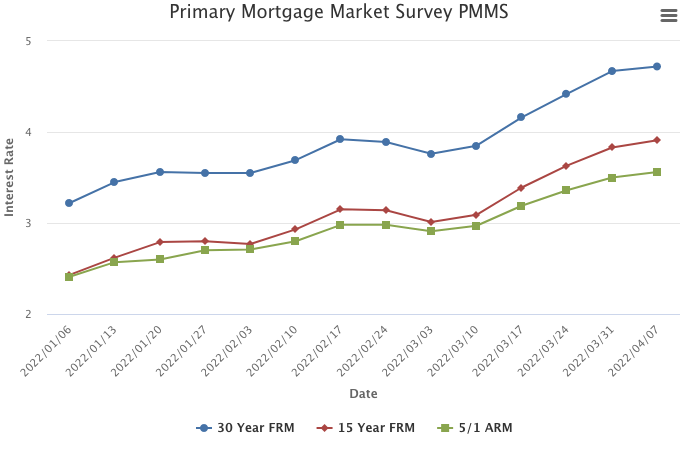
Mortgage rates have increased 1.5 percentage points over the last three months alone, the fastest three-month rise since May of 1994. The increase in mortgage rates has softened purchase activity such that the monthly payment for those looking to buy a home has risen by at least 20 percent from a year ago.
Information provided by Freddie Mac.
New Listings and Pending Sales
Inventory
Weekly Market Report
 For Week Ending March 26, 2022
Mortgage rates have surged recently, jumping to 4.42% the week ending March 24, up more than a quarter of a percentage point compared to the previous week, Freddie Mac reports. Rates have increased 1.2% since January and are at the highest level in more than 3 years, with the typical homebuyer now spending $250 more per month to purchase a home, according to the National Association of REALTORS®.
IN THE TWIN CITIES REGION, FOR THE WEEK ENDING MARCH 26:
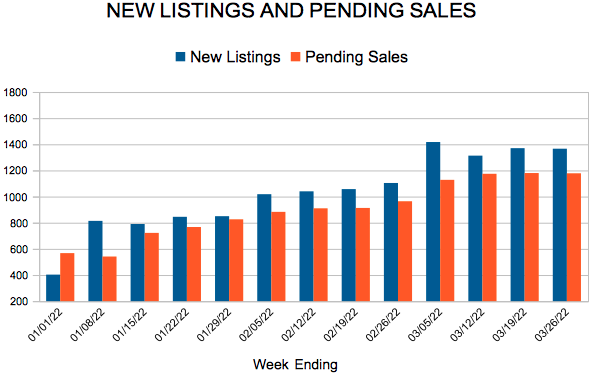
- New Listings decreased 12.8% to 1,366
- Pending Sales decreased 12.8% to 1,178
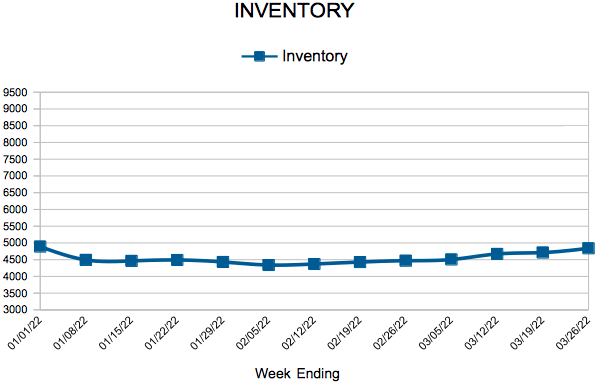
- Inventory decreased 13.7% to 4,839
FOR THE MONTH OF FEBRUARY:
- Median Sales Price increased 8.3% to $340,000
- Days on Market decreased 4.3% to 44
- Percent of Original List Price Received increased 0.7% to 100.8%
- Months Supply of Homes For Sale decreased 10.0% to 0.9
All comparisons are to 2021
Click here for the full Weekly Market Activity Report. From MAAR Market Data News.
Mortgage Rates Exceed Four and a Half Percent
March 31, 2022
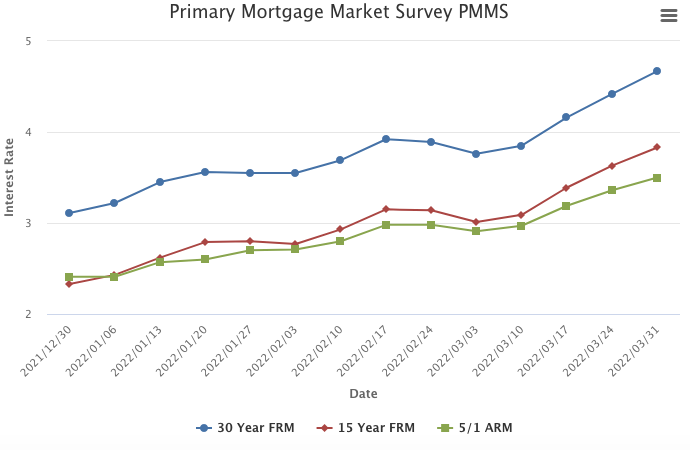
Mortgage rates continued moving upward in the face of rapidly rising inflation as well as the prospect of strong demand for goods and ongoing supply disruptions. Purchase demand has weakened modestly but has continued to outpace expectations. This is largely due to unmet demand from first-time homebuyers as well as a select few who had been waiting for rates to hit a cyclical low.
Information provided by Freddie Mac.
February Monthly Skinny Video
The U.S. real estate market remains hot ahead of the spring selling season, with existing home sales up 6.7% as of last measure. Experts attribute the growth in sales to an uptick in mortgage interest rates, as buyers rushed to lock down their home purchases before rates move higher. Even so, sales prices continue to rise with a Median Sales Price increase of 8.3 percent to $340,000 from this time last year.
New Listings and Pending Sales
- « Previous Page
- 1
- …
- 71
- 72
- 73
- 74
- 75
- …
- 103
- Next Page »


